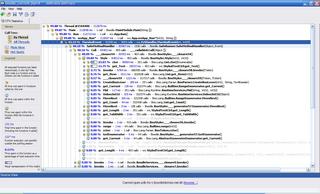
I spent a few hours staring at the code and tweaking it a little. Completely worthless adjustments. Couldn't find out why it was still so slow.
Finally got a REAL profiler - I normally just insert timer functions, but Boodle is a growing project, gettin' big, and that was gonna be a no-no.

So I download JetBrains dotTrace, have a little look-see, and wtf? Magic. I see I'm spending a bulk of the time during styling in a duck-typed closure I never even bothered checking out. I alter the closure to use static typing and wham, instant speed-up by an order of 2 magnitudes. Boodle doesn't choke on medium-sized files anymore! The profiler actually pointed out a few more hotspots that should be looked at, non-styler related, so I should get around to doing that before the profiler expires.
Its a nice piece of work that JetBrains has here, but its a bit lacking on features and it only shows .cs / .vb source files - kinda sucks. I'd rather it show any source file, sans colorization, or allow for colorization using syntax files. Seriously, anything is better than nothing.
Its way out of my price range, though - like a kajillion dollars too much. I'll be sad to see it go once the trial expires, but I couldn't justify the cash spent when I've got so little of it.
3 comments:
Hrm, how hard would it be to make a profiler for Boo?
I'm not sure I understand what you mean: most .NET profilers can profile any .NET application, because they all inspect the .pdb (to mark methods without needing to use source code) and do some sophisiticated timing benchmarks to normalize the data.
Why would Boo need a special profiler?
If you're hinting at a 'free' profiler for .NET in general, well, then, NProf would be the place to start modifying code, or using it as the code-base for your own version.
It kinda/sorta works, but the user interface is terrible and hard to navigate. A real pain in the ass kinda thing.
Post a Comment